I am currently writing a general purpose shared library for
acpi (more on that soon).
I was interested in having a function
call graph especially to see if the interface looks somehow clean and to include it in the documentation of the library. Of course I wanted to do it with open source tools. There are several tools for static call graphs but if you want dynamic call graphs you have to use additional features of your compiler to generate a graph based on code during runtime.
The first variant I tried was using
egypt a small perl script to generate a dot file. Dot (today included into
graphviz? is a tool originally developed at AT&T to generate hierarchical or layered drawings of directed graphs.
So what is needed?
First install software (here on a Debian systen, egypt is not included in Debian):
$ aptitude install graphviz graphicsmagick (+ download egypt from the homepage)
Compile your software using
gcc with the option
-dr to dump an RTL file of the source.
Most of gcc's work is done in an intermediate representation of your code, called register transfer language (RTL). This pretty much describes the instructions in plain text and is inspired by LISP lists.
Ok, here we go:
$ gcc -dr list.c libacpi.c test.c
This generates three RTL files, for every source file one. Depending on the gcc version the names may vary, here the names are libacpi.c.00.expand list.c.00.expand and test.c.00.expand.
Now use egypt to create a dot file (I don't want one for test.c now):
$ egypt libacpi.c.00.expand list.c.00.expand | dot -Gsize=100,100 -Grankdir=LR -Tps -o graph.ps
Egypt will create dot-output and by piping it to dot with -Tps -o graph.ps you get the resulting graph as a ps file. -Grankdir is used to generate a graph which runs from the left to the right, default is up-down which looks a bit strange.
Now convert the ps file into a png:
$ gm convert graph.ps graph.png
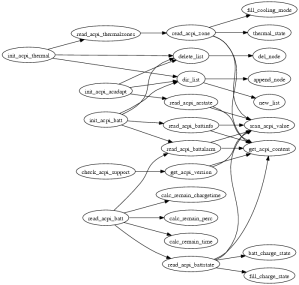
The result looks like this (looks cool huh?
):
The second variant I tested is a bit different and in my opinion the resulting graph looks a bit better.
The gcc commandline switch
-finstrument-functions allows easy creations of call-graphs for C/C++ (script languages used but I haven't tried).
You need to compile every file with the -finstrument-functions switch. Then gcc places a call to the functions
__cyg_profile_func_enter upon entering a function and
__cyg_profile_func_exit on leaving a function.
Compile your sources with -g and -finstrumental-functions:
$ gcc -g -finstrumental-functions list.c libacpi.c test.c -o test
Now you need to get some source code by Sebastian Krahmer (SuSE):
$ wget http://www.suse.de/~krahmer/instrumental/instrumental.tgz && tar xvfz instrumental.tgz && cd instrumental
Compile a shared object file:
$ cc -fPIC -c instrumental.c && ld -Bshareable instrumental.o -o inst.so
This generates a shared object file you can preload with LD_PRELOAD
$ LD_PRELOAD=./inst.so test
.....
Now you will find a log.inst.dot.<pid> and log.inst.ascii.<pid> in /tmp (path can be modified in instrumental.c).
The first file is a dot file you can now create a ps and a png file with but you need to attach a closing bracket
} at the end of the file since the package is not
able to intercept exit() or aborts. echo '}' >> log.inst.dot.<pid>
$ dot -Gsize=15,20 -Grankdir=LR -Tps -o graph.ps log.inst.dot.<pid> && gm convert graph.ps graph.png
The result looks like:
PDF file which scales a bit better
The other file represents the call graph in ascii:
~ [1000|1000|1000] -- main (0x8049ea4)
~ [1000|1000|1000] |-- check_acpi_support (0x8048984)
~ [1000|1000|1000] | |-- get_acpi_version (0x8048782)
~ [1000|1000|1000] | | |-- get_acpi_content (0x80486b4)
~ [1000|1000|1000] | | |-- scan_acpi_value (0x8048837)
~ [1000|1000|1000] |-- init_acpi_batt (0x80489d6)
~ [1000|1000|1000] | |-- dir_list (0x804a447)
~ [1000|1000|1000] | | |-- new_list (0x804a23c)
~ [1000|1000|1000] | | |-- append_node (0x804a309)
~ [1000|1000|1000] | |-- read_acpi_battinfo (0x80497d3)
~ [1000|1000|1000] | | |-- get_acpi_content (0x80486b4)
....
So both methods work but the first seems to be more useful if you want a graph for a specific file, not a specific program since you get an RTL file for each source file and you don't need all to create the dot file. The second method however looks better but has the limitation that you actually need to run the program (but that's dynamic and not static) and you can't (correct me if I miss something) create graphs for single files.
Have fun creating graphs for your favorite software and have a look into Sebastian Krahmers paper
http://www.suse.de/~krahmer/instrumental/instrumental.pdf and
http://www.ibm.com/developerworks/library/l-graphvis/. He also created a graph for
openssh http://www.suse.de/~krahmer/ossh4.6.pdf.
UPDATE: You can also use the capabilities of
valgrind to generate callgraphs in combination with a KDE tool named
kcachegrind. If you use valgrind --tool=callgrind programname you can get a file with a traced callgraph you can then use in kcachegrind to export a callgraph. I just did a quick test and it looks good but has two drawbacks, KDE sucks (well just a joke ; ) and if you use a .valgrindrc file with command line options specified you have to rename it or valgrind will complain. Thanks
Enrico for the hint.
Tracked: May 25, 09:05
Oder kann man das hiernach noch leugnen? Obiges ist der Callgraph des IRCd(2.11.1p1), angeregt durch Nions lesenswerten Blogpost.
Tracked: Jun 03, 23:44